
COVID-19: A New Insight into the Number of Unrecorded Cases
Based on new data, the previous spread of the COVID 19 epidemic in Austria was reassessed. This allows new deeper insights into the time development of the number of unreported cases. "We must proceed cautiously in this, because we would not immediately recognize a second wave of infection from the officially confirmed figures, but only after a delay" says Niki Popper, head of the research team.
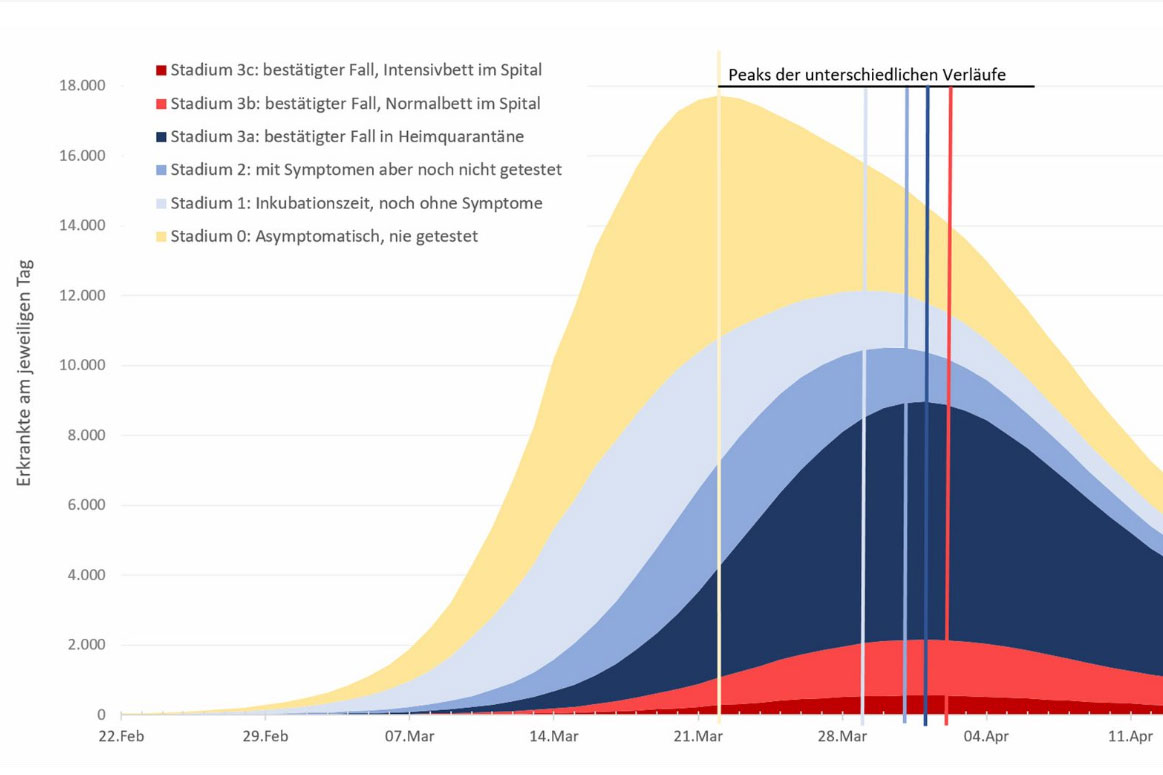 Course of the corona epidemic in Austria: Dark blue: positively tested case numbers. Red: persons in hospital. Dark red: in intensive medical treatment. Actual epidemic course: yellow. / Picture: © Technische Universität Wien / Institut für Information Systems Enngineering
Since the end of January, a team of the Vienna University of Technology and its spin-off company dwh has been using computer models to investigate the spread of COVID-19 in Austria.
The predictions made so far have come true - such as the extent to which the spread of the disease can be slowed down by contact reduction (from approx. 40% to less than 20% in the week from 13 March).
"In addition, we then used model calculations to support the demand planning for hospital beds for Vienna and Lower Austria, among other things, and helped to ensure that sufficient capacity was available at all times," says Niki Popper, head of the simulation team.
Now there is new data, including the number of unreported cases of current patients in Austria, which can be used to calibrate the previous models more accurately.
Thus, the previous course of events can be recapitulated with the help of simulations.
The following can be seen on the graph above: The dark blue epidemic curve corresponds to the number of positively tested cases (red: people in hospital; dark red: in intensive care). However, the actual course of the epidemic is strongly marked by the dark figure in yellow.
Different estimated number of unreported cases at the same time
Computer models, such as those developed and used by the TU Vienna and the TU Vienna spin-off dwh, can be used to map the entire temporal course from infection and the onset of the disease to any necessary admission to hospital or intensive care unit. This means that a virtual "look behind the scenes" of the previous course of the disease is now also possible using current data.
This closer look shows that the number of unreported cases and confirmed cases of illness take different courses over time.
It would be too easy to estimate the number of undetected cases of the total number of illnesses by simply multiplying the number of confirmed cases by a certain factor; the number of undetected cases is not a constant percentage of the total number of illnesses. Furthermore, the models show that it is possible to distinguish between different numbers of unreported cases.
All COVID-19-infected people go through different stages of the disease. During the incubation period (in the simulation stage 1), one still appears to be completely healthy.
In stage 2, symptoms begin slowly, and the infected person reacts to them.
A combination of the person's reaction time and the availability of the test determines when the person receives a positive test result and thus enters stage 3: only at this stage are infected people officially counted.
The computer model now distinguishes further depending on the treatment - between stage 3a (home quarantine), stage 3b (normal bed in hospital) and stage 3c (intensive care bed).
In many people (the model assumes a value of 50%) COVID-19 takes a (practically) asymptomatic course. These people are never tested and have no knowledge of the disease themselves. They are summarized in the model as "stage 0".
The numbers of persons in the different stages do not reach their peak at the same time in the simulation, they develop asynchronously.
Firstly, a certain amount of time always elapses until one develops symptoms after an infection, until one is tested and until the test results are available.
And secondly, on the basis of current literature, the disease does not last the same length of time in all people: people with asymptomatic disease progression are likely to have the infection behind them again quickly; in severe cases requiring hospitalisation, the disease lasts much longer.
All this can be taken into account in the agent-based model, therefore the curves of the time course (see graph) do not lie on top of each other, but are shifted against each other.
Time delay - even with a possible second wave
The number of people who are officially considered COVID-19 patients reached its maximum in the first days of April.
But the people who tested positive at that time had already gone through stages 1 and 2 before.
The simulation shows that the maximum number of infected persons (including unreported cases) therefore probably occurred two weeks earlier.
"Our simulations show that the peak of the disease figures of the past wave has been behind us for longer than the official figures show. At the same time, however, this also warns us to be careful," explains Niki Popper.
"If the number of infections rises again due to the relaxation of measures, there will be exactly the same time delay again. This means that we can only notice the increase in tests when the true number of infections in the population has already risen significantly.
Because of all these time delays, it is important to look ahead, especially now that the figures are developing well.
"We have to think anti-cyclically to a certain extent: when the number of confirmed cases of illness grew more slowly than before after the introduction of the measures, that was a very good sign," says Niki Popper.
"In many areas it is important to find a new, less strict normality. We must proceed cautiously in this respect, because we would not immediately recognize a second wave of infection from the officially confirmed figures, but again only after a delay. Finding this balance is a difficult political and social task, we hope to be able to contribute to it with our models".
Weekly updated forecast data
In the meantime, the team has joined forces with the Medical University of Vienna /Complexity Science Hub Vienna (CSH) and Gesundheit Österreich GmbH to form the COVID Prognosis Consortium. The three research groups now produce weekly joint forecasts on the course of COVID-19 patients in Austria and the currently available capacities in the hospital sector.